The problem of Polaris has been a stubborn one for those investigating the Flat Earth. The crux of this problem has to do with viewing angles, distances and elevation.
Using trigonometry, one should be able to measure the height of any object from any particular distance. Unfortunately, the math just doesn’t seem to add up. Using the supposed radius of the Earth – which is 3959.16 miles – we should be able to figure out the height of Polaris based upon the viewing angle and distance from the North Pole. The two assumptions – the radius of Earth and the distance from the North Pole – are generally agreed to values from both FE (Flat Earth) and GE (Globe Earth) people.
The viewing angle (“VA”) is where the problem starts – and ultimately will be resolved. GE theory states that the viewing angle of Polaris is equal to the particular latitude the observer views Polaris (ie. 49th parallel has a viewing angle of 49°). The distance from the 49th parallel to the North Pole is 2,597.55 miles or the radius of the Earth at that parallel. In the GE theory, the viewing angle is dependant upon the curvature of the Earth.
In the traditional FE view, Polaris is approximately 3600 miles above the North Pole. However, the viewing angle from the Equator is supposed to be 1° but according to traditional trigonometry, the viewing angle should be around 42° – Hence the paradox (or in GE theory, proof of a globe).
In examining this problem, I began by using a classic trigonometry set and drew, in 10° increments, the viewing angles from an object at 3600 miles above the North Pole. Several interesting anomalies appeared that, in the end, helped me resolve this problem.
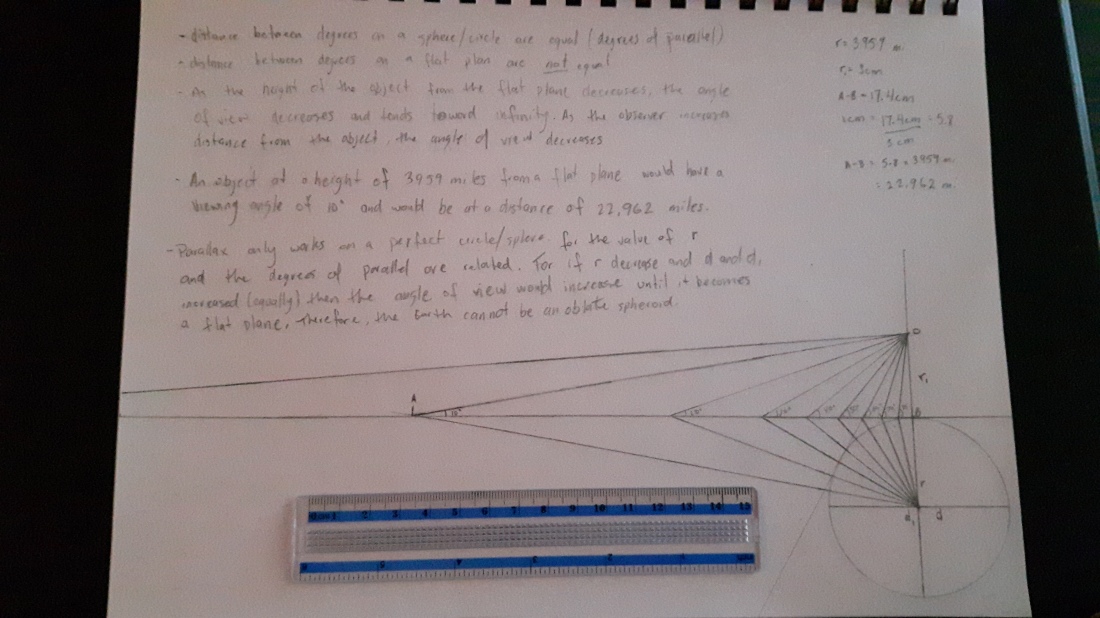
You can see from this image that the distances between the viewing angles are not equal. In GE theory, the distances between viewing angles are equal since the curvature is doing the work. I summed up these observations as follows:
- distance between degrees on a sphere/circle are equal (degrees of parallel)
- distance between degrees on a flat plane are not equal (this is important)
- As the height of an object from a flat plane decreases, the angle of view decreases and tends towards infinity (law of perspective using geometry). As the observer increases distance from the object, the angle of view decreases.
- The viewing angle is inversely proportional to the distance from the object. As the viewing angle doubles, the distance to the object is reduced by half.
- An object of 3959 miles from a flat plane would have a viewing angle of 10° and would be at a distance of 22,962.2 miles.
Observations 1-4 are all perfectly logical and fit well with the FE model. However, the 5 observation does not fit with known distances whether FE or GE. There is the possibility the FE model is incorrect but direct observations have shown that there is no curvature. We are right back in the middle of the paradox.
In an effort to resolve this confounding riddle, I began to model distances, heights and viewing angles in Excel and look for patterns or answers of some kind. After a few weeks of tinkering I developed this model:
https://docs.google.com/spreadsheets/d/11rVPrOIpXaej5OZxiUo13NdKwXUuHrI3Ul8IwBmOqaE/edit?usp=sharing
There are 2 assumptions in the model:
- The radius of the Earth (3.959.16 miles). All other numbers are generated using standard trigonometry and are without opinion or conjecture.
- There are 90° between the North Pole and the Equator
The model is defined by 1° increments (1-89) and uses TAN, COS and ATAN functions to obtain either an angle or a distance. There are two main sections separated by a blue line. The left hand section takes each viewing angle (starting at 1°) use a TAN function (H/TAN(VA)) to derive the distance. For example, and object that is 69.101 miles above the observer, would have a VA of 1° and a distance of 3958.79 miles. This equation is applied to each VA up to 89°.
I noticed that the VA and the distance are related to each other (see observations 3 & 4) up to and including the 32°. After that, the relationship doubles and the distance an observer is required to travel to double the VA is 4x the distance. I added a column that calculates the distance whenever the distance doubles starting at 1°. The distances correlate well but not perfectly. Plus, any differences increase as the distance decreases up to the 32° and then returns to normal after that. The distances are variable and change as the height of the object changes. By doing this, the actual VA is maintained and the distance alters the equation mentioned above. Another column (Apparent VA) was finally added but I will return to that one later as it is directly related to the solving of the paradox.
The right hand column uses the radius of the Earth as the fix value (rather then the VA in the left side). To obtain the actual viewing angle based upon distance from object, I used an ATAN function – ATAN(H/R). The common value between both sides is the object height. I derived the radius of the Earth at each degree by the following equation [Radius of Earth*COS((Degree)/180*3.14159)]. This essentially flattens out the Earth into a series of concentric circles.
Once all these relationships were in place, all I had to do was change one single value – the height – to see how the entire model behaved. The biggest pattern that I observed was the “compression” of VA as the distance and height increased. For example, at a relatively low height of 2 miles, all of the distances and VA matched the degree relative to the equator. However, as the height increased the VA began to “compress” at the lower VA values. As I increased the height, the VA differential (difference between the degrees from the equator and the actual VA) increased. You can observe the graph “Angle Differential” begin to form a SIN wave as the height increases. I haven’t taken the VA into decimal increments at the top and the bottom but my guess is that the pattern repeats.
So how important is this VA “compression”? As it turns out, it makes all the difference in the world. The model suggests that VA on a flat plane do not operate the same as VA on curved surfaces. As the distance from the object increases, the change in the actual viewing angle per degree increases at a slower rate. Take the above example of 69.101 miles – the rate of change from 1° to 16° is only 1° of VA (33° to 34°). As we can see, the VA does not increase at the same rate as the degrees from the equator. Therefore, on a flat plane we would expect a variable VA per degree from the equator whereas on a curved surface it would not be variable.
At 69.101 the VA from the equator is equal to 1°. However, as the height increases from this point, the VA becomes “compressed”. What do I mean by “compresses”? If you examine the “actual viewing angle” column on the right side of the model, you will notice that for the first 70° there is only a 3° change in VA. Within those first 3° the observer will notice very little change in the height of the object even over a great distance. It is only in the last few miles (from 76° to 89°) that any real movement in the object would be noticeable.
The phenomenon becomes even more exaggerated as the object increases in height. As I continually increased the height, I found that the height of Polaris would be 2,513.5 miles above the North Pole. At this height, the VA from the equator would actually be between 32° and 33°; all the remaining degrees are hidden from view since they are “compressed” into a small area below that degree. Of course no actual compression is happening but it is a phenomenon of perspective on a flat plane.
How can this be possible?
I was contemplating the problem of “compressed” VA but I could find anything that worked with the trigonometry – until I saw this awesome video by p-brane:
This video provides the mechanism with which the VA becomes “compressed” for objects near the horizon.
The human eye and perspective
An important piece to this puzzle is within the nature of the human eye. I have included two major references that the reader can take the time to read. The first is from Ian P. Howard (Perceiving in Depth, Volume 3: Other Mechanisms of Depth Perception, Volume 3 Chapter 26.4 .1(Effect of Height in the field of view)) and the second is Zetetic Astronomy, by ‘Parallax’ (pseud. Samuel Birley Rowbotham), [1881] chapter 14.
When looking at the horizon with the naked eye, (as opposed to using a telescope or binoculars) there are various laws of perspective that need to be considered.
Let’s take another example with an object at a height of 2.571 miles above the observer. To achieve a VA of 1° the observer would need to be 147.29 miles from the object. The observer would then have to move half that distance – 73.65 miles – to achieve a VA of 2°. However, if the observer traveled half the distance again – 36.82 miles – the VA would become 4°. This continues at the same rate until the VA is 32° at which the observer is merely 4.60 miles from the object. To achieve a 64° VA the observer would have to travel 4 times the distance – 1.15 miles from the object.
As we can see, the non-linear changes would have a direct impact on the VA based upon distance. We can put this model into practice through the observation and measurement of distant objects in relation to their height. For example, from Vancouver, BC, the distance to Mount Baker is approximately 68.39 miles. This would mean the VA would be approximately 1.71°. As an aside, if we assume a curvature of the planet, 1/3rd of Mt. Baker should be below the horizon when observed from Vancouver. In fact, 3,184 feet of 10,781 feet of the mountain would be below the horizon. As anyone from Vancouver has seen with their own eyes, the entire height of Mt. Baker can been seen (from base to peak) from 68.39 miles.
Take into consideration that 97% of the distance between Vancouver and Mt. Baker is traveled in the first 3rd of the VA (up to the 32°). The remaining 68° of VA occur during the last 3% of the journey. This will have an impact on how the human eye perceives objects at a distance. The VA is not constant. Because of this objects in the sky will appear higher or lower than they really are.
For example, an airplane flying overhead at 500 miles/hr will approach the observer slowly at first and then begin to accelerate as the distance decreases. The airplane will reach maximum velocity (from the point of view of the observer) when it is directly overhead. The plane will then begin to decrease velocity as it moves away. We all know that the speed of the plane has not changed but the VA is changing. The more distance the plane gets the slower it appears to go. If we take this example and apply it to static objects (like a mountain) the same rules apply. However, the change in VA is due to the observer. As the observer approaches the mountain, the VA changes but at an inconsistent rate. At a great distance the mountain will appear to “rise” up from the horizon at a very slow rate until the first 32° of VA are completed. After that the mountain will begin to “rise” at an accelerated rate.
If we now apply these observations to Polaris, we can see that 97% of the VA is far behind the Equator. According to the model, the star will rise at a much faster and consistent rate after the 32° (which the actual degree of parallel of the Equator). You have to imagine an observer that is 147,298 miles from the North Pole. At that distance the actual VA is 1°. It would take 97% of the journey before the star will begin to “rise” up from the horizon. After that point, the star “rises” and a relatively consistent rate (albeit not at 1° per degree of parallel – but close).
Another important observation that needs to be taken into consideration is the human eye itself. It is documented that the total VA that the eye is able to perceive if the observer is looking directly at the horizon is 60°. In other words, the total field of view is only 60°. Also, the field of view also contains the ground beneath our feet. So within that 60° we have 100% of the field of view.
It is important to note that the model being presented is scalable for any object at any height (assuming the radius of earth being valid). This means we can use this model to accurately map the surface of the Earth using an object at a constant height (ie. Polaris).

Wouldn’t the apparent compression as an object gets closer to the horizon be more readily observable? The moon looks round whether it’s high in the sky or close to the horizon. Shouldn’t it look more compressed the closer it got to the horizon?
LikeLike
Have you read my update:
https://eternalworldorder.com/2017/04/11/polaris-paradox-update/ which fixes some issues with the model?
It might explain it a bit better.
LikeLike
I see you don’t monetize your blog, don’t waste your traffic,
you can earn extra cash every month because you’ve got hi quality content.
If you want to know how to make extra $$$, search for: best adsense alternative
Wrastain’s tools
LikeLike
I have noticed you don’t monetize your blog, don’t
waste your traffic, you can earn extra cash every month because you’ve got high quality
content. If you want to know how to make extra bucks, search for: Mrdalekjd methods for $$$
LikeLike